Vultax Research · Archive projects
Two documented forecast archives
Published by Christopher Geneth Kurg · 25 October 2026
Each edition keeps an original research archive intact, credits its creators, and asks the same question from a different field: what was forecast, when could it have been known, and how did it turn out?
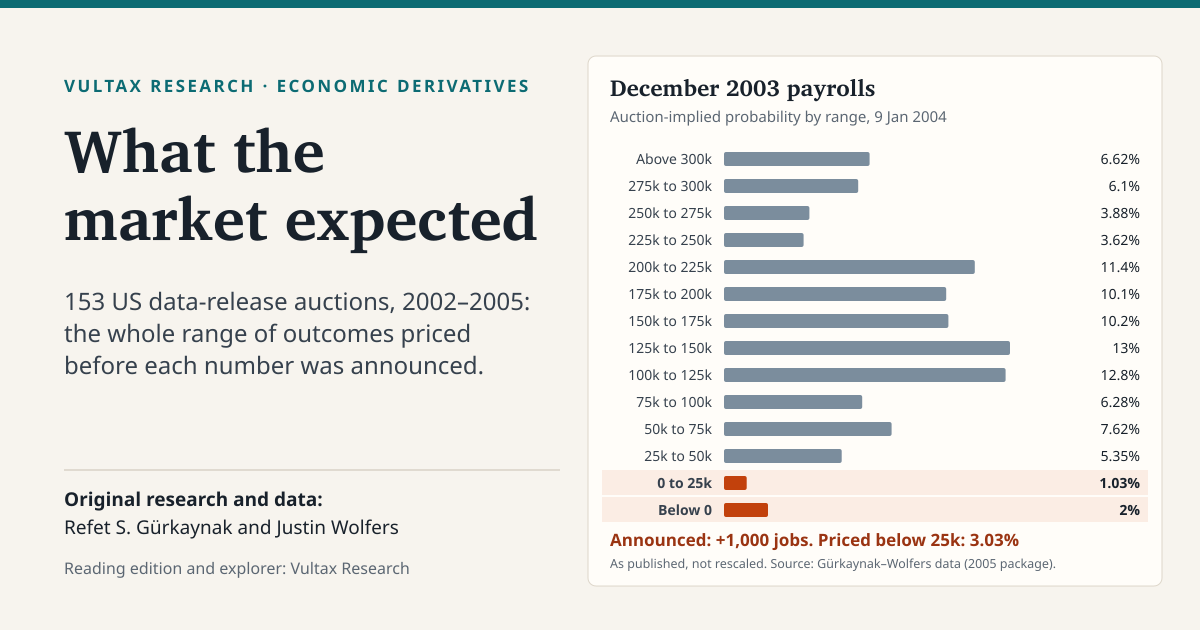
What the market expected
- Scholarly question
- Before a US data release, what range of outcomes did an auction price, and how should that distribution be read against the announced number?
- Original creators
- Refet S. Gürkaynak and Justin Wolfers collected the auction results for their study (FRBSF Working Paper 2005-26; NBER Working Paper 11929, 2006, doi:10.3386/w11929) and published the data. Justin Wolfers gave permission to republish the auction portion with credit.
- What Vultax added
- An allowlisted, curated auction-only edition of the authors’ 153 release records and 2,235 priced ranges, each value checked against the original package; units, source rows and flags for totals that miss 100, open tails and 23 exact-boundary results; CSV and JSON downloads; credited chart export; a teaching exercise; a proposed evaluation protocol (no calibration result yet).
- Inspect now
- Every release with its announced value, the source row behind each, the validation script and its results, and examples chosen by stated rules.
- Still unresolved
- How the contracts treated exact ties; why some totals miss 100; no full-sample evaluation yet; not reviewed by the authors; no deposit or DOI.
Open the article and explorer →
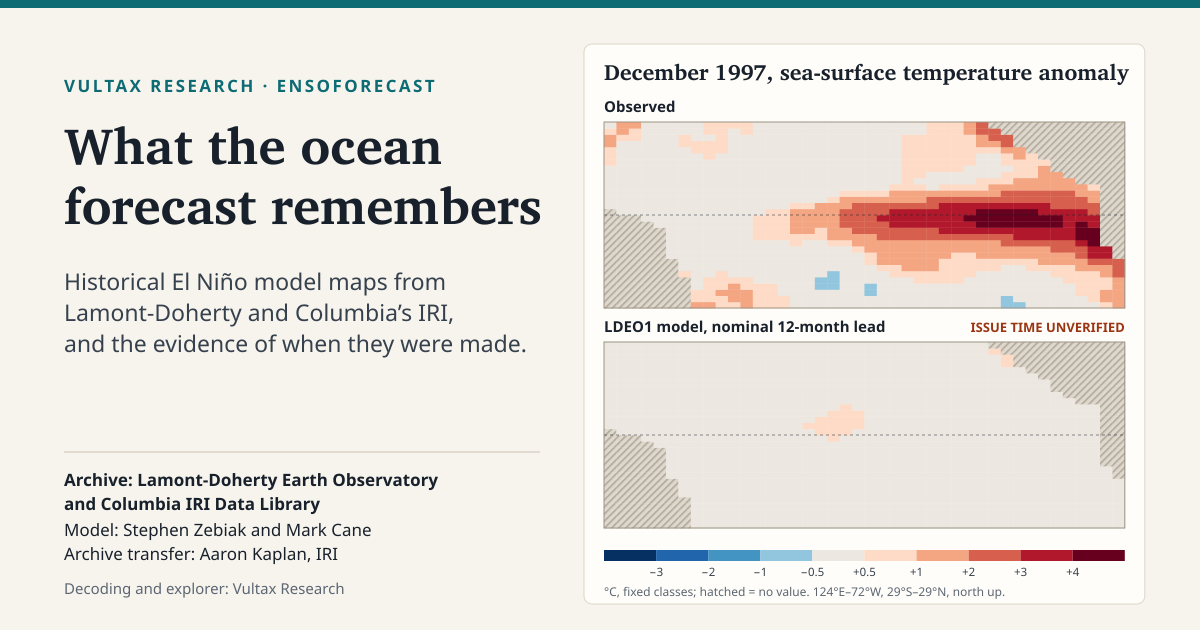
What the ocean forecast remembers
- Scholarly question
- What can historical El Niño model maps tell us, and what evidence shows when each was made?
- Original creators
- Forecasts by the Lamont-Doherty Earth Observatory climate group with the model of Stephen E. Zebiak and Mark A. Cane (1987), held by the Columbia IRI Data Library. Aaron Kaplan (IRI) assembled and transferred the archive as the library wound down.
- What Vultax added
- Decoding and full checks of the nine catalogued core files (316 common target months; 316–338 paired with observations); 18 decoded maps for December 1982 and 1997; an evidence ledger built from contemporaneous 1996–1997 LDEO bulletins; credited map export; a teaching exercise; a proposed evaluation protocol (no skill result yet).
- Inspect now
- Both target months, both products, four leads, cell-by-cell readout, coverage of every file, and the source and evidence class behind each map.
- Still unresolved
- The anomaly reference period; the observation product; whether the 1997 fields are what was issued; no skill evaluation; not reviewed by the archive's creators; no deposit or DOI.
Open the article and explorer →
Both editions are public research candidates prepared by Vultax Research, operated by OmniOS OÜ, Tallinn, in October 2026. Credit for the research and the archives belongs to the creators named above; nothing here implies their review or endorsement. Corrections are logged by ID in each edition's version history.