We Tested Polymarket Prices Against 6,776 Resolved Markets. Here's Where They Bend.
Original Vultax research: in an experimental test, a calibrated fair-value model beat raw Polymarket prices by ~9.6% on held-out Brier score. Where the favorite-longshot effect lives, what the model can honestly flag, and why it still is not a trading edge.
AI-assisted drafting, research and editing. Published by OmniOS OÜ. How we use AI
Validation sample
06,776 markets
Resolved Yes/No markets with known outcomes.
- Brier improvement
- ≈ +0.09.6%
- Experimental, held-out markets: 0.0352 → 0.0319 versus raw market prices.
- Where prices bend
- Near 00 and 1
- The calibrated mapping's improvement concentrated at the longshot and near-certain ends of the price range.
- Football long shots: the bend a $50,000 floor invented
- 10.3 → 1.5 pts
- Contracts at 10 to 30¢ a day before kick-off, July to September 2026: kept only above $50,000 at close, then every market of the same 2,101 matches
The question a fair-value model must answer
Prediction-market prices are good probability estimates on average — that is the standard result, and it held in our data. But 'good on average' leaves room for systematic, repeatable distortion, and the best-documented one is the favorite-longshot effect: low-probability outcomes trade above their true frequency and near-certain outcomes trade slightly below it.
A fair-value model, honestly defined, answers one question: given where this market is priced, where did markets priced like it historically resolve? That is a calibration question, and calibration questions have a standard scoring rule.
Method and result
We assembled resolved Yes/No Polymarket markets with known outcomes — 6,776 after filtering for resolvability — and, as an experimental test, fit a calibration mapping from market price to resolved frequency and scored it on held-out markets. The scoring rule is the Brier score: mean squared error between stated probability and outcome, where lower is better. Contracts that ask whether something happens by a date are scored separately, by distance to the deadline, in the deadline-markets study.
Raw market prices scored approximately 0.0352. The calibrated mapping scored approximately 0.0319 — an improvement of roughly 9.6%. The improvement concentrates where theory says it should: at the probability extremes, where longshot enthusiasm and near-certainty discounting are strongest.
- Sample: 6,776 resolved Yes/No markets.
- Score: held-out Brier, 0.0352 → 0.0319.
- Improvement: ≈ 9.6% versus raw prices.
- Effect concentrated near the 0 and 1 extremes.
- Status: experimental.
A fresh check: 9,132 markets read a day before they closed
To see where prices bend now, we ran the test again on public data. The sample is every Polymarket market with a Yes and a No outcome that was scheduled to end between 1 July and 30 September 2026, had resolved, and had traded $50,000 or more: 9,234 markets. Each was read at its Yes price 24 hours before it closed, from Polymarket's price history; 9,132 markets in 3,692 events had a price within two hours of that moment. Polymarket's own accuracy page also scores prices at fixed times before the end.
The prices carried real information. Their Brier score was 0.133, against 0.225 for a forecast that gave every market the same 34.3% chance, the share that came true. The score is higher than the 0.0352 above because the samples differ: this one reads prices a day out and is full of football matches priced near even, where no forecast can score well.
Most bands sat close to their prices. Contracts at 50 to 70¢ averaged 58.4¢ and came true 58.1% of the time; at 70 to 90¢, 78.8¢ and 79.3%. Near certainty the bend the first test found appeared again: contracts at 90 to 98¢ averaged 94.8¢ and came true 98.8% of the time. The band that missed by most was 10 to 30¢: 20.6¢ on average, and 28.1% came true. The next section shows that most of that miss is made by the sample, not by the market.
Price a day before close against the share that came true, by price band
Polymarket Yes/No markets with $50,000+ traded, scheduled to end 1 July to 30 September 2026, read 24 hours before close. Percent.
- Average price
- Share that came true
Where the gold line sits above the grey one, contracts came true more often than their price said. The 95% intervals are in the table below.
Chart: Vultax Research
Show the numbers
| Point | Average price | Share that came true |
|---|---|---|
| under 2¢ | 0.4% | 0.6% |
| 2–10¢ | 5.3% | 6.9% |
| 10–30¢ | 21% | 28% |
| 30–50¢ | 40% | 43% |
| 50–70¢ | 58% | 58% |
| 70–90¢ | 79% | 79% |
| 90–98¢ | 95% | 99% |
| 98¢ and over | 100% | 100% |
| Price a day before close | Markets | Events | Average price | Came true | 95% interval (by event) |
|---|---|---|---|---|---|
| under 2¢ | 2,240 | 760 | 0.4¢ | 0.6% | 0.3–1.0% |
| 2–10¢ | 1,025 | 622 | 5.3¢ | 6.9% | 5.2–8.6% |
| 10–30¢ | 1,793 | 1,320 | 20.6¢ | 28.1% | 26.1–30.1% |
| 30–50¢ | 1,627 | 1,269 | 40.2¢ | 42.7% | 40.7–44.9% |
| 50–70¢ | 1,187 | 1,165 | 58.4¢ | 58.1% | 55.3–60.9% |
| 70–90¢ | 469 | 437 | 78.8¢ | 79.3% | 75.7–82.9% |
| 90–98¢ | 251 | 227 | 94.8¢ | 98.8% | 97.3–100.0% |
| 98¢ and over | 540 | 276 | 99.5¢ | 99.8% | 99.4–100.0% |
Download table figures:CSVJSON with sources
Download chart figures:CSVJSON with sources
How a volume floor can invent a bend
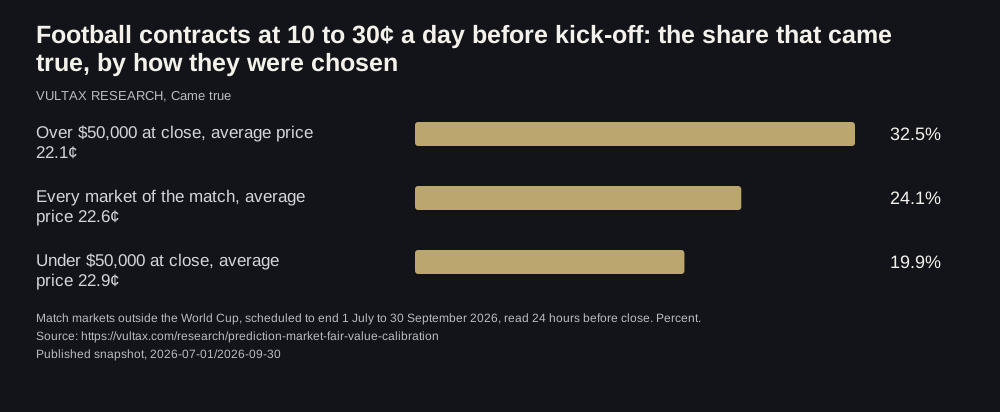
The 10 to 30¢ miss is mostly sport: 1,474 of the 1,793 contracts in the band. Most of those are football match markets outside the World Cup, "Will this team win on this date?" and "Will it be a draw?". There, 1,097 contracts priced 10 to 30¢ a day before kick-off averaged 22.1¢, and 32.5% of them came true.
The $50,000 floor is the reason. Volume is counted at close, so it includes trading during the match, and an upset brings a rush of it on the underdog and the draw. A long shot that wins is far more likely to clear $50,000 than one that loses. The floor picks the winners after the fact.
Counting every market of the same 2,101 matches, whatever its volume, removes that choice. The 10 to 30¢ band then held 3,242 contracts at an average of 22.6¢, and 24.1% came true, with an interval of 22.8 to 25.4%. The contracts that stayed under $50,000 came true 19.9% of the time at 22.9¢. The same matches, read the same way, show a bend of 10.3 points or 1.5, depending only on a filter applied after the result.
The World Cup is the control. Its markets traded far above $50,000 whatever happened, so the floor chose nothing there, and its contracts at 10 to 30¢ averaged 18.3¢ and came true 18.6% of the time.
The lesson reaches beyond this page. A calibration study that keeps only markets above a volume, liquidity or interest threshold measured at the end selects on the outcome. The threshold has to be set before the result: on volume traded up to the moment of the reading, or on every market of an event.
Football contracts at 10 to 30¢ a day before kick-off: the share that came true, by how they were chosen
Match markets outside the World Cup, scheduled to end 1 July to 30 September 2026, read 24 hours before close. Percent.
Each row's average price is in its label. 894 markets of these matches had no price within two hours of the reading and are left out.
Chart: Vultax Research
Show the numbers
| Category | Came true |
|---|---|
| Over $50,000 at close, average price 22.1¢ | 33% |
| Every market of the match, average price 22.6¢ | 24% |
| Under $50,000 at close, average price 22.9¢ | 20% |
Download chart figures:CSVJSON with sourcesSVG chart
Why this is not a trading edge
The distance between a calibration result and a tradeable edge is wide, and it is worth walking through it explicitly. First, the improvement is an aggregate: it says the population of prices bends in a known way, not that any specific market is wrong today. Second, the largest dislocations sit at the extremes, where bid-ask spreads are widest relative to the gap — a two-cent theoretical dislocation inside a three-cent spread is not an opportunity, it is noise with good posture.
Third, capture requires timing and settlement: the market can stay 'dislocated' until resolution, and the honest benchmark for any live-edge claim is close-line value — did flagged prices systematically beat the closing line? That measurement is future work on our roadmap, and until it exists, the product treats every fair-value flag as watch context. Vultax presents every fair-value flag as context to investigate, never as a recommendation, and this article follows the same rule.
How to use the fair-value watch honestly
Used as designed, the fair-value watch is an attention allocator. A market flagged outside its calibrated band is a market worth understanding: check the liquidity, check the event room, check who is trading it and whether venues agree. Sometimes the price is stale; sometimes the flag is thin-category noise; sometimes the market simply knows something the base rates do not.
That triage — flag, then investigate structure — is the entire honest use of the model. Anyone promising more from a calibration curve is selling past their evidence.
Polymarket Brier score: calculation and comparison limits
For binary outcomes, Brier score = the average of (forecast probability − outcome)². Enter probability between 0 and 1, and outcome as 1 for Yes or 0 for No. Lower is better. A constant 50% forecast scores 0.25 on every resolved Yes/No question; that does not make 0.25 the right benchmark for every sample.
A worked example, not a market observation: a 70% forecast scores (0.70 − 1)² = 0.09 if Yes occurs, and (0.70 − 0)² = 0.49 if No occurs. One of each produces an average of 0.29. Use the Brier score calculator to score your own resolved forecasts and compare them with a constant reference.
A Polymarket Brier score is meaningful only with its sampling rules. Record the time of each price, the time remaining until resolution, the markets included, how ambiguous outcomes were treated and whether markets have equal weight. Correlated outcomes from one event should not be mistaken for independent evidence.
Polymarket's accuracy page describes snapshots at several horizons before resolution. Its headline score and this study's historical result are not a like-for-like contest without the same questions, horizons, outcome rules and weighting. Neither a low Brier score nor better calibration establishes profit after costs.
Context from elsewhere
The published evidence on calibration has grown quickly. Kalshi's own August 2026 study over more than 2.2 million data points found no systematic bias in aggregate, forecasts improving with time, participation and volume, and markets with about $10,000 of volume or twenty traders already informative; its offered yardstick is the 0.10–0.15 Brier scores of skilled superforecasters. A 2026 academic study of 594 Kalshi macro markets reported an overall Brier of 0.0987, with federal-funds-rate contracts near-perfect (0.0001) and unemployment-rate contracts weakest (0.1302), and the one-hour horizon far better than the thirty-day one (0.0812 against 0.1587). Horizon, more than venue, decides the number.
Volume-weighted calibration inherits a problem this site has written about elsewhere. Columbia researchers flagged about a quarter of Polymarket's volume over three years as wash trading, peaking near 60% in December 2024 and highest in sports markets; a calibration curve weighted by volume gives those prints a vote. The weekly test on this page weights by volume for comparability and states the floor it uses; the bend it finds at the extremes should be read with that in mind.
Downloads contain the published study figures. Changing market widgets are separate. Use Vultax research with an AI assistant. Press note.
Questions this page answers
- How accurate are prediction markets?
- There is no single accuracy number for every market and forecast horizon. This historical Vultax experiment reports Brier scores of approximately 0.0352 for raw prices and 0.0319 after calibration across 6,776 resolved markets. Those results do not establish current platform accuracy or live trading returns.
- What is a Brier score?
- For a resolved binary question, it is (forecast probability − outcome) squared, averaged across the chosen sample. Probabilities run from 0 to 1 and outcomes are 0 or 1. Zero is perfect; a constant 50% forecast scores 0.25. State the sample, horizon and weighting before comparing two scores.
- What is the favourite-longshot bias?
- The tendency for low-priced contracts to win less often than their price implies and high-priced ones more often. The article measures it on 6,776 resolved markets; the weekly pack checks whether it persists.
- Is a mispriced market a trading edge?
- Not on its own. The bend is small, fees and spreads sit on top of it, and it is measured after the fact across thousands of markets. The section above on why this is not an edge is the durable part of this page.
- Do Polymarket underdogs win more often than their price says?
- Not once the sample is chosen fairly. In football match markets from July to September 2026, contracts at 10 to 30¢ a day before kick-off came true 24.1% of the time at an average of 22.6¢ when every market of each match was counted. Keeping only markets that traded $50,000 by close raised that to 32.5%, because upsets draw trading during the match.
- Why does a volume filter bias a calibration test?
- Because volume counted at the end depends on what happened. Markets where something surprising happened attract more trading, so a threshold set on final volume keeps more of the surprises that came true. Set the threshold on volume up to the moment of the reading, or keep every market of an event.
Revision notes
This page is kept current. Each entry records what changed and when; the live figures above refresh on their own.
- Added a fresh check on 9,132 markets that ended July to September 2026, read a day before close, and a test showing how a volume floor counted at close invents a bend in football markets.
- Expanded the Brier-score explanation with a labelled arithmetic example, benchmark limits and a calculator link. Preserved the existing section anchor. No new calibration experiment was run.
- Added a free calculation or lookup alongside this study, using the reader's own inputs. The original measured results and observation window are unchanged.
Sources and evidence
- Brier score (background)
The proper scoring rule used for validation.
- Favorite-longshot bias (background)
The market-structure effect the calibration captures.
- Kalshi Research — Prediction market calibration: how accurate is Kalshi? (20 Aug 2026)
The venue's own study over more than 2.2 million data points: forecasts improve with time, participation and volume; markets with about $10,000 or twenty traders were already informative; the comparison offered is superforecaster Brier scores of 0.10–0.15.
- Krause — Calibration and Forecast Accuracy of Macroeconomic Prediction Markets: Evidence from Kalshi, 2025–2026 (SSRN)
594 Kalshi macro markets, 1,860 observations, nine series: overall Brier 0.0987; federal-funds-rate markets near-perfectly calibrated (0.0001); unemployment-rate markets the weakest (0.1302); one-hour horizon 0.0812 against 0.1587 at thirty days, as summarised in the abstract.
- Gizmodo — Study finds around a quarter of Polymarket trades are fake (Columbia, Nov 2025)
About 25% of Polymarket volume over three years flagged as wash trading by counterparty structure, peaking near 60% in December 2024; roughly one wallet in seven flagged; many flagged wallets made no profit.
- CoinDesk — Polymarket's trading volume may be 25% fake, Columbia study finds
Sports markets carried the highest flagged share (about 45% of historical volume); election markets about 17%.
- Polymarket — accuracy methodology
Read 6 October 2026. Used for forecast-horizon context, not as a directly comparable score or a new Vultax measurement.
- Polymarket Gamma API: markets and events
Resolved Yes/No markets scheduled to end 1 July to 30 September 2026, and every market of each football match; read 19 October 2026
- Polymarket CLOB: price history
Yes price 24 hours before each market closed, hourly points within two hours of the reading
Vultax articles are market intelligence and education, not investment advice. This is a description of an experimental, backtested calibration result with explicit limitations; it is not a claim of live tradeable edge, and no market flagged by the model is a recommendation.
Watch this measurement live in Vultax.
Every open Polymarket market with its price history, liquidity and Vultax analytics.
New studies, by email.
Measured, sourced, and sent once per study. No digests, no promotions.
Continue reading
Polymarket 'By Date' Favourites at 84¢ a Month Out Came True 64% of the Time
Every settled Polymarket market worded 'by' or 'before' a date, January 2025 to April 2026, scored against its price 90, 30 and 7 days before the deadline and clustered by event. Markets above 65¢ a month out came true 64.3% of the time; a week out, 90.5%.
Polymarket efficiency: two tests, updated monthly
On PredictIt, the bids on every outcome of a busy market added up to 110 to 125¢. On Polymarket the typical event adds up to 87¢, and long shots win more often than their price says. Two tests, rerun every month.
Nobel Peace Prize odds: 2026 result, saved forecast and 2025 study
Navi Pillay won the 2026 Nobel Peace Prize. Compare the official result with our frozen forecast, dated 2026 market snapshots and the 2025 study of prices before the announcement.
World Series 2026 Odds: Brewers 62%, Rays 38%, After the Dodgers Led 264 of 271 Days
The Milwaukee Brewers are 62.1% to beat the Tampa Bay Rays in the 2026 World Series on Polymarket, against 2.2% on 1 February. The Dodgers led the market on 264 of its 271 days and were swept. In 2025 the Dodgers fell to 10.5% in Game 7 and won.