Where unusual Polymarket wins concentrate
The same published accounts beat entry-price expectations on one auditor’s clients, with no excess elsewhere. A broader wallet screen raises a different question.
KPMG-client cycles, selected group
032 / 37
23.331 initial-direction wins implied by entry prices; not a profit estimate.
- Other known auditors, same group
- 028 / 55
- 30.704 wins implied by entry prices; no excess on this comparison group.
- Subject-screen selections
- 0321
- 22,322 eligible wallets; 51.252 selected on average in the stated simulations. Not an insider count.
Read the paper and use the data
Download the six-page paper (PDF). Download the aggregate tables and calculation script (ZIP). Copy the citation.
Research note, version 1.0, 8 October 2026. This is exploratory historical research and has not been peer reviewed.
The finding: the same accounts, different company groups
The most useful contrast in our follow-up study is where a selected group's extra wins occur. Across thirteen wallet addresses published in earlier reporting, initial positions on KPMG-audited companies won 32 times in 37 company reporting cycles. Their entry prices implied 23.3 wins. On companies with other known auditors, the same group won 28 times in 55 cycles, against 30.7 expected.
That is about nine more wins than the price benchmark on KPMG clients, with no excess on the comparison group. Counting each company reporting cycle once prevents several wallets taking the same position from turning one result into several independent successes.
The comparison is exploratory: these accounts were already selected for attention. It neither reconstructs the entire group described in the press nor establishes who controlled the accounts, what they knew, or wrongdoing by an audit firm. Its value is a precise pattern that can be tested further.
Initial-direction wins, counted once per company reporting cycle
Thirteen published addresses; historical fills, January 2025 to April 2026. Each bar counts wins, not profit.
- Price-implied expected wins
- Observed wins
Chart: Vultax Research
Show the numbers
| Category | Price-implied expected wins | Observed wins |
|---|---|---|
| KPMG clients (37 cycles) | 23 | 32 |
| Other known auditors (55 cycles) | 31 | 28 |
| Company group | Reporting cycles | Observed wins | Price-implied wins | Excess wins |
|---|---|---|---|---|
| KPMG clients | 37 | 32 | 23.331 | +8.669 |
| Other known auditors | 55 | 28 | 30.704 | −2.704 |
Download table figures:CSVJSON with sources
Download chart figures:CSVJSON with sources
What 'expected wins' means
Buying an outcome at 70 cents is different from buying it at 10 cents. We use the recorded entry price as a probability benchmark and add those probabilities across the counted positions. For the 37 KPMG-client cycles, that sum is 23.331; the observed total is 32. The observed win rate is 86.5%, compared with 63.1% implied by prices. For the 55 other-auditor cycles, the rates are 50.9% and 55.8%.
These are wins of the initially chosen direction, not realised profit, return on capital or a trading recommendation. Prices can be miscalibrated. Outcomes can be related. A gap from this benchmark is something to explain, not a probability that somebody used private information.
How much of the market did we study?
The historical archive used in this work contains 714.7 million fills across 834,732 markets from 1 January 2025 to 28 April 2026. Our broader subject search excludes sports, esports and fixed-clock crypto, leaving 135,284 markets. The particular screen described below has 22,322 eligible wallets. The earnings comparison above concerns thirteen previously published addresses and 92 pooled company reporting cycles.
Those are different populations. The earnings result is not an estimate for all traders, and the broader screen is not a count of insiders. This is historical Polymarket research, not complete coverage of prediction markets or trading through today.
A broader screen finds an excess that needs explaining
We also asked whether unusually successful trading concentrates within a wallet's dominant subject. One reference rule requires at least 80% of observed lifetime directional acquisition cost in that subject, entry into it within three days of first observed activity, at least three resolved events, and at least $2,500 of resolved subject cost. Wallets first observed before February 2025 are excluded from this reference to reduce the problem of histories starting before the archive.
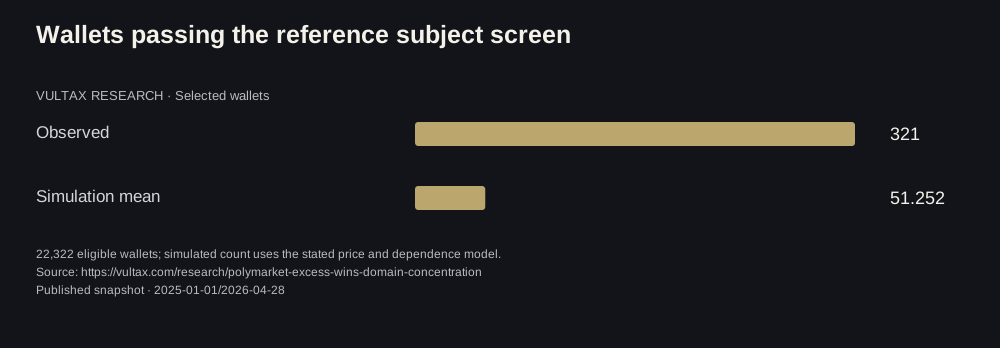
Of 22,322 wallets eligible before the success test, 321 passed a model-based upper-tail threshold of 0.01. Under 500 simulations that retained the observed entries and non-success filters, the mean count was 51.252 and the 5th-to-95th percentile range was 27 to 87. The observed count is about 6.3 times the simulated mean. Weather and daily-temperature subjects account for 162 of the 321 selections.
That contrast depends on the model. The simulations preserve some shared-event dependence but do not reproduce adaptive trading, cross-event relationships or pricing errors. Public information and skill also remain possible explanations. The simulation band describes simulated selection counts; it is not a confidence interval for the number of insiders.
Wallets passing the reference subject screen
22,322 eligible wallets; simulated count uses the stated price and dependence model.
Chart: Vultax Research
Show the numbers
| Category | Selected wallets |
|---|---|
| Observed | 321 |
| Simulation mean | 51 |
Download chart figures:CSVJSON with sourcesSVG chart
The unsuccessful screens are part of the result
A tight screen for large, low-price bets by newly observed wallets within 48 hours of an outcome left 1,316 bets after correcting the dollar-concentration calculation. Its average gap against matched established-wallet bets was -5.40 cents per share, with a market-bootstrap 95% interval of -10.53 to -0.07 cents. Only 93.3% of the selected bets entered that matched comparison.
Allowing related markets to count as one topic recovers more of the studied examples, but the broader versions do not show a clearly positive average matched gap. The initial population grid tested 216 combinations; an improved subject grid contained 72 primary cells plus 144 history-coverage rows. No single population cell retained all studied case wallets. These overlapping searches are not independent confirmations.
What would make the earnings comparison more persuasive?
The next check is to compare companies of similar size within the same sectors. The existing auditor-label permutations keep all of a company's reporting cycles together and preserve the number of companies assigned to each auditor, but they do not preserve sector or company-size differences. A comparison that survives those controls would narrow an important alternative explanation.
We would then freeze the rule, its data requirements and the performance measure before examining a later period. That prospective test has not been completed. The present result supplies a specific research question: does the concentration of excess wins persist after a fairer comparison and outside the period used to develop the screen?
Correction and how to cite this work
An earlier Vultax publication reported 1,331 strict-screen bets and a matched gap of -5.2 cents. Its concentration gate used raw token notional instead of each wallet leg's directional exposure cost. Correcting the gate removes 24 bets and adds 9, leaving 1,316; the corrected matched estimate is -5.40 cents. The negative conclusion remains. This paper reports the corrected comparisons that were recomputed; it does not certify every sensitivity table in the earlier publication.
Suggested citation: Vultax Research (2026). Where unusual Polymarket wins concentrate: An exploratory comparison of published earnings accounts, market-implied expectations and broader wallet screens. Research note, version 1.0, 8 October 2026.
The paper sets out the methods, eight topic/time comparisons, limits and source references. The companion data package contains aggregate tables, a calculation script and file hashes. It is an auditable summary of saved research outputs, not a complete environment for rerunning the full fill archive. This work has not been peer reviewed.
Downloads contain the published study figures. Changing market widgets are separate. Use Vultax research with an AI assistant. Press note.
Sources and evidence
- Boka Qin and Rui Yang. TimeSeventeen/Polymarket-v1 dataset and data definitions (CC BY 4.0)
- PCAOB. AuditorSearch and Form AP: public annual-auditor records
- EventWaves. KPMG-Audited Companies are Trading Strangely on Polymarket. Source of the initial nine and supplementary four published addresses
- Polymarket. Gamma API documentation: event metadata
- Vultax Research. Earlier long-shot and tight-screen study. Read with the correction in this note
These retrospective comparisons do not establish insider trading, common ownership, wrongdoing by an audit firm or a reliable way to identify informed traders in advance. The paper describes saved research outputs, selection effects and model limitations. Analysis: Vultax Research.
Continue your research in Vultax.
Explore crypto and prediction markets, trader analytics and event monitors. Public research views are free to browse.
New studies, by email.
Measured, sourced, and sent once per study. No digests, no promotions.
Continue reading
Polymarket Insider Trading: The Charged Cases, and What a Screen Catches
The long-shot screen tested on historical Polymarket fills, with a correction to the tight screen: 1,316 bets and a matched gap of −5.40 cents per share. Earlier sensitivity tables are retained as historical results.
1.6% of Polymarket Wallets Never Sleep. They Made 58% of All Trades.
Hourly activity for 130,346 Polymarket wallets over 12 days in August and September 2026: 2,080 wallets were active in every hour of the clock and filled 58.4% of 9.82 million trades. The ten busiest wallets alone filled one trade in five. Half of all wallets traded on a single day.
Polymarket 'By Date' Favourites at 84¢ a Month Out Came True 64% of the Time
Every settled Polymarket market worded 'by' or 'before' a date, January 2025 to April 2026, scored against its price 90, 30 and 7 days before the deadline and clustered by event. Markets above 65¢ a month out came true 64.3% of the time; a week out, 90.5%.