How to Read Election Odds: Five Checks Before You Trust a Prediction-Market Price
Abstract
A prediction-market price is what a $1 contract costs, not a vote share. On seven thin midterm contracts in September 2026 a $10,000 buy paid 24 to 69¢ above the screen price, and political long shots won more often than priced. Five checks, and how Vultax will score 13,186 midterm contracts.
AI-assisted drafting, research and editing. Published by OmniOS OÜ. How we use AI
- Cite as
- Kurg, Christopher Geneth (2026). How to Read Election Odds: Five Checks Before You Trust a Prediction-Market Price. Vultax Research notes 2026-040, Vultax Research, Tallinn, 28 October 2026. https://vultax.com/research/how-to-read-election-odds No DOI has been assigned.
- Data availability
- 2 tables and charts are downloadable as CSV and JSON with their sources, in the sections below.
- Limitations
- Method and limits, below.
$10,000 on a Polymarket long shot, paid above the screen price
24 to 69¢
Seven midterm candidates priced 1.1 to 8.5¢, median over 58 order-book readings on 12 and 13 September 2026. On a Democratic House the same buy paid 0.5¢.
- Midterm races with a favourite at 90¢ or more
- 402 of 507
- Senate, House and governor races at the scorecard freeze, 03:34 UTC on 17 October 2026, read as the midpoint of the best bid and ask.
- Favourite-longshot slope, Polymarket political contracts
- 0.91
- 3,663 contracts in 1,298 events, January 2025 to September 2026, read a week before the scheduled end. Below 1 means long shots won more often than their price said.
- Midterm scorecard manifest, SHA-256, first eight characters
- 5b607bde
- 13,186 contracts in 1,352 events, frozen 17 October 2026. The scored price is read at 23:59 UTC on 2 November. The first scoring run is planned for 4 to 6 November.
The short answer
A price on an election market is what a contract that pays $1 costs. If prices are well calibrated, candidates priced near 70¢ win about 7 races in 10 across many races. Before reading a midterm price that way, check five things: what the number on the screen is, how much money stands behind it, whether a sudden move has held, where on the scale it sits, and which clock it was read on.
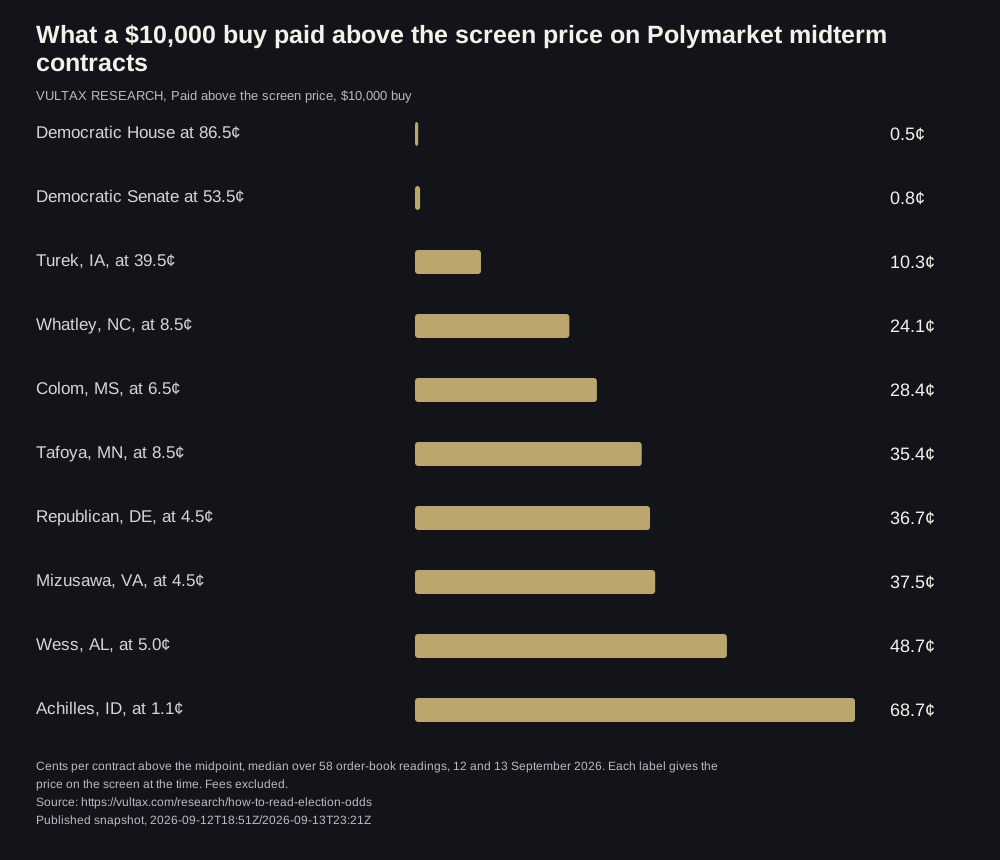
The money check changes the most readings. In 58 order-book readings on 12 and 13 September 2026, a $10,000 buy of a Democratic House paid 0.5¢ above Polymarket's screen price. On seven candidates priced under 10¢, the same buy paid 24 to 69¢ above it.
What a $10,000 buy paid above the screen price on Polymarket midterm contracts
Cents per contract above the midpoint, median over 58 order-book readings, 12 and 13 September 2026. Each label gives the price on the screen at the time. Fees excluded.
Chart: Vultax Research
Show the numbers
| Category | Paid above the screen price, $10,000 buy |
|---|---|
| Democratic House at 86.5¢ | 0.5 ¢ |
| Democratic Senate at 53.5¢ | 0.8 ¢ |
| Turek, IA, at 39.5¢ | 10 ¢ |
| Whatley, NC, at 8.5¢ | 24 ¢ |
| Colom, MS, at 6.5¢ | 28 ¢ |
| Tafoya, MN, at 8.5¢ | 35 ¢ |
| Republican, DE, at 4.5¢ | 37 ¢ |
| Mizusawa, VA, at 4.5¢ | 38 ¢ |
| Wess, AL, at 5.0¢ | 49 ¢ |
| Achilles, ID, at 1.1¢ | 69 ¢ |
Download chart figures:CSVJSON with sourcesSVG chart
- The number: Polymarket shows the midpoint of the best bid and best ask, or the last trade when the two are more than 10¢ apart.
- The money: on a thin contract one order can move the price by tens of cents.
- The move: a jump is a price change. Who traded, and whether it lasts, are separate questions.
- The ends: on Polymarket political contracts from 2025 to 2026, long shots won more often than their price said.
- The clock: compare prices read at the same time before a date known in advance.
What a price says, and what it does not
A Polymarket contract pays $1 if its event happens and nothing if it does not, so a price of 70¢ reads as a 70% chance. Justin Wolfers and Eric Zitzewitz showed in 2006 that, under common assumptions about how traders bet, the price lands close to the average belief of the people trading, which is why the reading usually works. It is still a chance of winning, not a share of the vote. A candidate at 90¢ may be expected to win by two points or by twenty.
The number on the screen is a convention. Polymarket's help page says the price shown is the midpoint of the best bid and the best ask, unless the two are more than 10¢ apart, when the last traded price is shown instead. On a busy contract the two agree. On a thin one the last trade can be hours old and sit anywhere in a wide gap, so the honest reading is a range: the market says the chance lies between the bid and the ask. A screen that shows the last trade, the bid, the ask and the size on offer together tells the reader what the market actually knows.
Thin contracts: the price at your size
A price is only as solid as the orders behind it. For a study of 65 midterm contracts, Vultax walked a $1,000, a $10,000 and a $50,000 buy through Polymarket's order books every 30 minutes from 18:51 UTC on 12 September to 23:21 UTC on 13 September 2026, without placing an order. On a Democratic House, $50,000 paid 1.3¢ above the screen price. On James Talarico in Texas it paid 6.6¢, and the book could fill it at all in only 16% of the readings.
Long shots sit on the least. For the seven candidates in the chart priced at 1.1 to 8.5¢, a $10,000 buy paid 24 to 69¢ above the price, an average cost of 33 to 70¢ a share. On a book that holds a few hundred dollars near the quote, one order can move the price by tens of points, and the new price says little about the race. The midterm scorecard keeps such contracts but flags every one whose bid and ask are more than 10¢ apart.
A jump is a price change, not a verdict
When a contract moves from 50¢ to 70¢, the fact on record is a 20¢ price change. Whether the trader meant to push the price, and whether the new price will last, are separate questions that the move alone does not answer.
The cleanest test of the second question is a field experiment. On the Iowa Electronic Markets in 2000, Paul Rhode and Koleman Strumpf made planned, random investments worth about 2% of the market's total volume, so the trades carried no information about the race. Prices rose at first. Half of the effect was undone within two and a half hours and all of it within twelve. Across Wall Street election betting from 1880 to 1944 and an online market in 2004 they found the same pattern, with the period of distortion shrinking over time from days to hours to minutes.
That is evidence about price pressure in the markets they studied, not a ruling on any single move in 2026. The 2026 record calls for the same caution. In a Vultax study of Polymarket's 400 busiest open markets from 18 September to 2 October 2026, 1,375 of 1,985 sharp moves, 69%, happened while less than $1,500 changed hands, and a day later 47.6% of the 1,778 moves that could be followed had given back half or more. A sudden move is a fact about the order book before it is a fact about the race. Check how much money traded, whether the move held for hours, and whether related contracts moved with it.
Where long shots and favourites bend
Prices near the ends of the scale are the least reliable as probabilities. The best-documented distortion is the favourite-longshot bias: long shots priced above how often they win. Eric Zitzewitz's 2026 study of PredictIt reports a slope of 1.369 for election contracts read a week before the vote, where a slope above 1 means long shots won less often than their price implied.
On Polymarket the same test ran the other way. Across 3,663 political contracts in 1,298 events with scheduled ends from January 2025 to September 2026, read a week before each scheduled end, the slope was 0.91, with a bootstrap range of 0.84 to 0.97: long shots won more often than their price said. The samples and price rules differ, so this is not a matched comparison. The test is rerun every month in the efficiency series.
For the midterms the practical reading is modest. A candidate at 5¢ is not a candidate at zero, and a favourite at 95¢ is not a certainty. At the scorecard freeze, 402 of 507 Senate, House and governor races had a favourite at 90¢ or more, so most of what the election can confirm or refute sits at the top of the scale.
Read every price on the same clock
A price is a reading at a time. A study that scores markets has to read every contract at a fixed point before a date known in advance, the scheduled end, and not before the moment the market actually closed. Markets whose result becomes known early close early: of 110,576 Polymarket markets that ended between 15 August and 10 September 2026, 37% closed before their scheduled end because the outcome was already known.
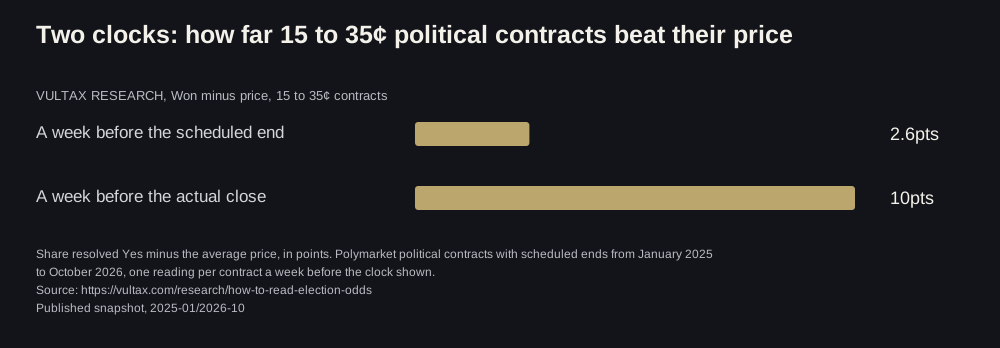
Anchoring the reading to the actual close uses something nobody knew at the time: when the result would arrive. Contracts that won early enter that sample at their price a week before the win, and cheap contracts look more underpriced than they were. In the efficiency series, political contracts priced 15 to 35¢ beat their price by 2.6 points when read a week before the scheduled end, across 665 contracts, and by 10.0 points when read a week before the actual close, across 747. The samples differ because the actual close depends on the outcome, which is why the scheduled end is the clock to use.
Election night has clocks of its own. Polymarket pays a Senate race once the Associated Press, Fox News and NBC have all called it, so a race can stay open, and its price below $1, until the last of the three calls. A price read before the polls close is a forecast. A price read after the calls is a result waiting to be paid.
Two clocks: how far 15 to 35¢ political contracts beat their price
Share resolved Yes minus the average price, in points. Polymarket political contracts with scheduled ends from January 2025 to October 2026, one reading per contract a week before the clock shown.
Chart: Vultax Research
Show the numbers
| Category | Won minus price, 15 to 35¢ contracts |
|---|---|
| A week before the scheduled end | 2.6 pts |
| A week before the actual close | 10 pts |
Download chart figures:CSVJSON with sourcesSVG chart
How Vultax will score the midterms
Vultax froze every Polymarket contract about the 2026 midterms before the vote: 13,186 contracts in 1,352 events, swept at 03:34 UTC on 17 October 2026. The manifest's SHA-256 begins 5b607bde. The full hash, the rules and the code are on the scorecard page, so anyone can check that nothing was added or changed once results were known.
The forecast that counts is the midpoint of each contract's best bid and best ask at 23:59 UTC on 2 November, the night before the vote. A second reading at the same hour on 27 October measures what the last week added. Each contract gets a Brier score, the squared gap between its price and what happened. Means are reported over contracts and over races, favourites are counted by 10¢ band, and the scores are set against two baselines: a constant 50¢ and the 27 October price.
Results come from state election authorities, with Polymarket's own payout kept as a second record. The first scoring run is planned for 4 to 6 November 2026. A race still being counted then stays pending and is filled in by a later dated run that never rewrites an earlier one. One election is one election, and the scorecard will say how little independent evidence a single night supplies.
Method and limits
This explainer computes nothing new. Every figure is quoted from a published Vultax study or a cited paper, with its own window: the depth readings and Polymarket's Senate settlement rule from the September study of 65 midterm contracts, the slope and clock readings from the efficiency series and its data download, the early-close share from the settlement study, the sharp-move counts from the study of 1,985 moves and the freeze figures from the midterm scorecard. Prices are from Polymarket's international exchange. No other venue is compared.
The working paper by Paul Rhode and Koleman Strumpf is cited exactly as its authors give it, below. The field experiment result is on its printed page 22. Order-book depth changes as a campaign develops, and the September readings describe September books. Nothing here is a forecast by Vultax or advice to trade.
Rhode, P and K Strumpf (2008).
Manipulating Political Stock Markets: A Field Experiment and a Century of Observational Data.
working paper available at https://users.wfu.edu/strumpks/papers/ManipIHT_June2008(KS).pdf
Downloads reproduce this page’s tables and charts with their source notes. Live market widgets are separate. Use Vultax research with an AI assistant. Press note.
Revision notes
This page is kept current. Each entry records what changed and when; the live figures above refresh on their own.
- Published before the 3 November 2026 US midterm elections. Every figure is quoted from a published Vultax study or a cited paper, with its original window.
Sources and evidence
- Rhode, P and K Strumpf (2008). Manipulating Political Stock Markets: A Field Experiment and a Century of Observational Data. working paper
The full citation, as the authors give it, is under Method and limits. Field experiment on the Iowa Electronic Markets in 2000, printed page 22. The abstract and conclusion cover the Wall Street and 2004 cases.
- Wolfers, J. and Zitzewitz, E. — Interpreting Prediction Market Prices as Probabilities, NBER Working Paper 12200, 2006
When a price equals the average belief of traders, and why it may not.
- Zitzewitz, E. — Limits to Arbitrage and Prediction Market Efficiency: the Case of PredictIt, NBER Working Paper 35845, 2026
Table 8, election contracts one week out: favourite-longshot slope 1.369.
- Polymarket Help Center — How Are Prices Calculated?
The displayed price is the midpoint of the bid-ask spread unless the spread is over $0.10, when the last traded price is used. Read 20 October 2026.
- Vultax Research — Polymarket 2026 midterm scorecard
Frozen manifest, rules, checkpoints and code, published 17 October 2026.
- Vultax Research — Polymarket efficiency series and method note
Favourite-longshot slope, bootstrap ranges and the clock diagnostic, first release 16 October 2026.
- Vultax Research — Polymarket vs Kalshi midterm odds, 65 matched contracts
Order-book depth readings, 12 and 13 September 2026. Only the Polymarket figures are quoted here.
- Vultax Research — 69% of sharp Polymarket price moves happened on under $1,500
1,985 moves of 3 points or more inside 30 minutes, 400 busiest open markets, 18 September to 2 October 2026.
- Vultax Research — How Polymarket settles markets
110,576 markets that ended between 15 August and 10 September 2026.
- Conditional formula proofs
Conditional formulas only. The proofs cover the conditional mathematical formulas; article-specific measurements and numerical results have not been proved.
- Per-article scope records and Lean package
Dated per-article scope records, Lean source, frozen permitted public inputs, checker logs and a reproducible ZIP. Covers only the scope stated in each record, not the whole study.
An explainer built on published Vultax measurements and the cited papers, each with its own window, on Polymarket only. Not a forecast by Vultax and not advice to trade.
Watch this measurement live in Vultax.
Senate, House and governor races priced live on Polymarket, with control odds, seat math and the day's biggest movers.
New studies, by email.
Measured, sourced, and sent once per study. No digests, no promotions.
Continue reading
Polymarket 2026 midterm scorecard: 13,186 contracts frozen before the vote
Every Polymarket contract about the 2026 US midterms, frozen on 17 October: 13,186 contracts in 1,352 events, a hashed manifest, two price checkpoints and a Brier rule declared before the vote. In 402 of 507 races the favourite already trades at 90¢ or more.
Polymarket 'By Date' Favourites a Month Out: 64% Came True, and 79% in a 2026 Recheck
Every settled Polymarket market worded 'by' or 'before' a date, January 2025 to April 2026, scored against its price 90, 30 and 7 days before the deadline and clustered by event. Markets above 65¢ a month out came true 64.3% of the time; a week out, 90.5%.
Nobel Peace Prize odds: 2026 result, saved forecast and 2025 study
Navi Pillay won the 2026 Nobel Peace Prize. Compare the official result with our frozen forecast, dated 2026 market snapshots and the 2025 study of prices before the announcement.
Calibration of Polymarket prices against 6,776 resolved markets
Original Vultax research: in an experimental test, a calibrated fair-value model beat raw Polymarket prices by ~9.6% on held-out Brier score. Where the favorite-longshot effect lives, what the model can honestly flag, and why it still is not a trading edge.